


In light of the Covid impact, organizations have been forced to relook at their business and reprioritize what matters most. Fundamentally, organizations would need to continue earning revenue while keeping their costs low without impacting operational efficiency. Operational efficiency is something which can be relooked at as an organization grows, increase in bureaucratic processes and hierarchies starts to stifle innovation and slow down decision making.
Organizations has been known for redeploying talent to other parts of the business and launching new business models be it moving online or allowing curbside pickups for retailers instead of delivery within a week.
This demonstrates the need for speed that organizations needs to urgently take apart their underlying assumptions on ways of working, organizational structure and talent.
Ways of Working
Just like the infamous pizza rule by Amazon , it has been mentioned that every internal team should be small enough that it can be fed with two pizzas . The purpose was to make meetings more effective by limiting the number of people participating. Expanding on this rule, it can become more efficient by having less meetings and less decision makers in each meetings. Outlawing Powerpoint presentations like how Amazon did and replacing with a six page narrative memo may be hard to change culturally at first.
Frequency in making decisions from quarterly to annual is one way of moving with speed and allows the organization to be flexibles especially in areas of resource planning.
Delegating decisions to lower level employees requires leaders to make a brave decision and empower their subordinates to act and accept mistakes that is not business critical. That allows leaders not to be bogged down by every decision making being centred on that one individual.
I recently read about this concept of the highest paid person’s opinion a.k.a HIPPOS where by the one with the biggest job title and salary puts them in a position of influence and power. It is detrimental to the organization when decisions are slowed down by a bucket of new ideas from HIPPOS. It would be best to address or manage the HIPPOs behavior by having data to validate or invalidate the decisions . Alternatively , one can challenge the HIPPOs when there is a clear product backlog or roadmap which will force a decision against the existing top 5 projects and ultimately will help to kill the idea or questions from HIPPOs.
Organizational Structure
By flattening the organizational structure, there would be less time lost in organizating briefing or workshops, report preparation and approval board meetings. The tools and processes must adapt to support flatter structure and this means less middle management with more doers.
A flatter structure can be supported by looking at the span of control in an organization. Span of control means the number of employees that the manaer should manage.
An example of how organizations can use the tools at hand to evaluate the effectiveness of their organization structure would be to look at analytics and artificial intelligence.
For organizations heavily invested in Microsoft, Microsoft Viva is an employee experience platform that brings together communications, knowledge, learning, resources, and insights in the flow of work. It can be used to generate employee and manager insights into information tracked on Microsoft Teams and Outlook.
A dashboard can be built to identify the frequencies of meetings, meetings held outside working hours, multitasking with chat and meetings simultaneously and the number of meetings that a line manager have with their subordinates. These information act as insights which leads to actions such as reviewing the job scope of top multitaskers or increasing the number of line manager and subordinate meetings to ensure that subordinates do not feel left out and manager have a better grip on the team’s morale.
Talent
With Covid, organizations are finding that lower level employees are rising to the occasion by leading and driving strategies while some leaders are still stuck in the old bureaucratic way of working. This is not something that will change overnight for organizations being invested in their current development plan for leaders.
Besides that, talent in the organization can be encouraged to be a citizen developer. Citizen developer are business users who can create their own applications with no prior coding experience. This has experienced a boom with the rise of low code and no code development platforms to enable users to build their own apps.
Typically the use case for applications like this would be a form/data collection app, workflow application that orchestrate processes and replacement for paper ,email or spreadsheets. One such tool that is suitable for enterprise would be the Microsoft Power Apps. It can be integrated with the Microsoft suite of products to build an application such as a employee recognition platform and car fleet booking app. It does sound simplistic to say that the applications can be built. Like any application, there would be a learning curve for users learning to build an application and to learn about the finer details on web app and mobile app development or publishing.
What can you do?
You can try to present an analysis on the span of control in your organization. In order to do that, you would need access to confidential HR data and have a suitable tool for presentation. Setting the HR data aside, the best tool for presentation would be to use Streamlit.
What can Streamlit do?
Firstly, Streamlit can be used to present the requirements in a single web page followed by the data visualization supported by Plotly Express that can demonstrate the span of control. Plotly Express is a terse, consistent, high-level API for creating figures.
Lets see it in action then.
Firstly, assuming that you are able to get hold of HR data in a csv or excel format, it typically contains employee id, personal details, job function and other related job information. Therefore, as a bare minimum, the data should have the link between the employee and the line manager and the function that they belong to.
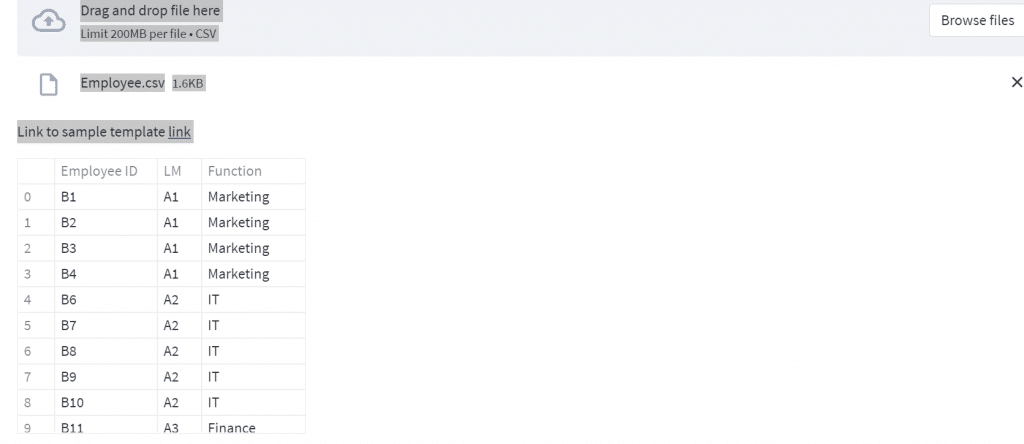
Following that, you can use your Python skills to manipulate the data to do a count of unique values to reach the output below. With the transformed file, you can then demonstrate the span of control of your organization by function and number of people per line manager.
Key Points to Ponder
- The span of control can vary depending on the type of organization you have whereby a commercial entity would have smaller span of control as compared to a shared services entity.
- This initial analysis would lead to more questions such as what would be the average span of control per function and level e. middle management vs senior management.
- Assuming that the ideal span of control is determined, it would lead to replanning of resources and analysis of cost savings with the change in organization structure.
- It would be worth your time to explore other organizational planning and design software platform like Orgvue that comes with out of box solutions while having best practises from other clients e.g HSBC and FEDEX.


