


Employee engagement in simple terms means how connected are you with your work, the teams that you work with and the organization that you belong to. An engaged employee would intend to stay long term in an organization as opposed to a disengaged employee that may be indifferent or even disruptive at their workplace. Engagement should not be confused with how happy an employee is working or what is the state of employee wellbeing. Employee engagement ultimately relates to the employees connection with the organization.
How does one measures employee engagement?
In most cases, there is a key performance indicator that is used to measure employee engagement and assess how the organization’s goals are being met. These measurements are essential as it can improve employee performance and enhance the employee’s loyalty towards the organization. A fully engaged employee will help to support company objectives and drive the performance of the organization. One of the key metric used for measurement is absenteeism. It would be useful to have a employee performance dashboard measuring absenteeis,.
What is Absenteeism?
Absenteeism rate is derived based on a percentage of the total working days for the entire workforce. The calculation is shown below
Absence rate = Total days absent ÷ (Number of employees × Number of workdays) × 100
The actual number of workdays is typically calculatd by taking 365 days per annum and subtracting the number of working days(Mondays to Fridays) and the public holidays for the country that the organization is located.
Based on the absenteeism rate, one can gauge if there are many employees are with low motivation to work. It is worth noting that there is a related concept to absenteeism described as presenteeism. Presenteeism is said to be able to affect workplace productivity because employees are trying to work even if they are not feeling well. In this instance, it cannot be determined based on the absenteeism rate as productivity can be hard to measured for employees who are present at work.
As part of the measurement, it is essential to be able to identify the categories of absenteeism and the impact to the organization. Categories here refers to the type of leave that an employee may take. It can include medical leave, occupational leave, maternity or paternity leave and compassionate leave.
The category of leave taken can help to identify gaps at workplace such as declining safety standards when number of occupational leave increases dramatically as evidenced by workplace injuries.
The other types of leave such as paid leave or unpaid leave and maternity /paternity leave or training can be measured but excluded from a dashboard for absenteeism.
Data
Typically the source of truth would be from HCM sytem be it Workday or Successfactors or Peoplesoft. What matter is the ease of exporting data into the excel or csv format with the relevant information. Relevant information includes the following;
Employee ID/Gender/Age/Function/Grade/Location/Legal Entity/Number of leave taken and which leave type.
What tool should I use?
Streamlit
For a interactive and scalable solution, one can start with Streamlit. As a tool favored by data science teams, it works on Python and has many data visualization libraries that can be used to build a useful dashboard. Plotly ’s Python graphing library makes interactive, publication-quality graphs and one can easily make line plots, scatter plots, area charts, bar charts, error bars, box plots, histograms, heatmaps, subplots, multiple-axes, polar charts, and bubble charts.
Anvil
Alternatively one could also try Anvil.works. There are pros and cons of using Anvil. It comes with web based IDE, drag and drog interface, built in database(Postgres) and can be deployed to the cloud with one click. The cons typically involves learning how to use Anvil.works and it comes with a pricing plan that ranges from $14 to $649 with different features.

Let’s Get Started with Streamlit
You would need to install Streamlit and its required libraries.
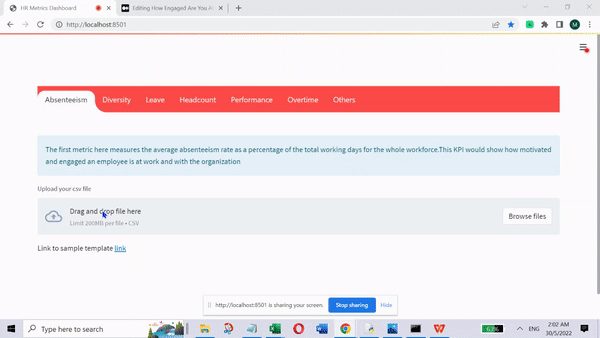
Once that is done, you can code the dashboard to allow you to upload a file and process the data for dashbard presentation immediately
From the gif above, you can see the Absenteeism dashboard is broken down into gender, age, function and lost days. Below the dashboard , a table view of the source data is shown for reference. In Streamlit, it comes with a component that can display a metric in big bold font, with an optional indicator of how the metric changed. It is used to show metric for absenteeism rate and lost days. Lost days is based on the number of lost days taken for the whole workforce.
Besides the metric component, one can include Plotly bar chart and contour plot chart for analysis of absenteeism data. The bar chart can be used to show the absenteeism by function and gender and help to identify if there are less engaged employees in certain functions. As for the contour plot, it can be useful to plot how value Z changes as a function of two inputs, X and Y. In this instance, one can see how the Z(number of leave taken) changes based on age of employees and month. It could reflect that number of leave taken is higher for the employees that are in their 50s as compared to their younger counterparts.
The overall benefits of Streamlit is that it is hosted on the cloud and can be used easily for presentation instead of relying on the common powerpoint slide.
Key Takeways
- Employee engagement starts with absenteeism and has other metrics to look into such as overtime hours, training costs, employee productivity and cost per hire.
- From a tool’s perspective, if your organization is highly invested in Microsoft suite of tools , the same dashboard can also be built with PowerBI.
- Data would always be the biggest hurdle for any dashboard to be automated and accurate as the need to factor in the integration of HCM data to a secure cloud and access control to restrict who can view HR dashboard.
- The insights and information gleaned from dashboard needs to be clear and with next actions to improve e.g high absenteeism from factory employees requires a deep dive into the root causes. It can divulge poor resource allocation or an overworked labour force.
- Absenteeism is one way of measuring productivity but there is also another concept of presenteesim at work that employees are not fully functionationg at the workplace due to illness and are difficult to quantify.


